| 21 Mechanical Properties of the Lung and Chest Wall: Static and Dynamic
|
| Lung mechanics is the study of the mechanical properties of the lung and the chest wall (which includes the rib cage, diaphragm, abdominal cavity, and anterior abdominal muscles). The primary function of the lung is gas exchange. To achieve this primary function, air must be moved in and out of the lung. The mechanical properties of the lung and chest wall determine the ease or difficulty of this air movement. An understanding of lung mechanics is important to comprehend both how the lung works normally and how the lung works in the presence of disease because almost all lung diseases affect the mechanical properties of the lung. In addition, death from lung disease is almost always due to an inability to overcome the altered mechanical properties of the lung or chest wall, or both. Lung mechanics includes static mechanics (the mechanical properties of a lung whose volume is not changing with time) and dynamic mechanics (properties of a lung whose volume is changing with time). Both are described in this chapter.
|
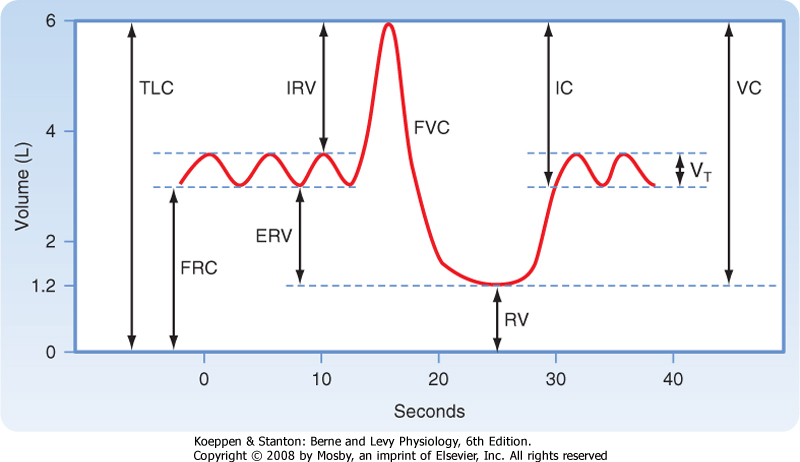
| Clinical evaluation of lung function and the study of static lung mechanics begin with the measurement of lung volumes (Fig. 21-1) and the factors that determine these volumes. All lung volumes are subdivisions of total lung capacity (TLC), the total volume of air that can be contained in the lung. Lung volumes are reported in liters either as volumes or as capacities. A capacity is composed of two or more volumes. Many lung volumes are measured with a spirometer. The patient is asked to first breathe normally into the spirometer, and the volume of air (the tidal volume [VT]) that is moved with each quiet breath is measured. The subject then inhales maximally and exhales forcefully and completely, and the volume of that exhaled air is measured. The total volume of exhaled air, from a maximal inspiration to a maximal exhalation, is the vital capacity (VC). Residual volume (RV) is the air remaining in the lung after a complete exhalation. TLC is the sum of VC and RV; it is the total volume of air contained in the lungs, and it includes the volume of air that can be moved (VC) and the volume of air that is always present (trapped) in the lung (RV). Functional residual capacity (FRC) is the volume of air in the lung at the end of exhalation during quiet breathing and is also called the resting volume of the lung. FRC is composed of RV and the expiratory reserve volume (ERV; the volume of air that can be exhaled from FRC to RV).
|
| The ratio of RV to TLC (RV/TLC ratio) is used to distinguish different types of pulmonary disease. In normal individuals, this ratio is usually less than 0.25. Thus, in a healthy individual, approximately 25% of the total volume of air in the lung is trapped. An elevated RV/TLC ratio, secondary to an increase in RV out of proportion to any increase in TLC, is seen in diseases associated with airway obstruction, known as obstructive pulmonary diseases. An elevated RV/TLC ratio can also be caused by a decrease in TLC, which occurs in individuals with restrictive lung diseases. Measurement of these lung volumes is described later.
|
| Determinants of Lung Volume
|
| What determines the volume of air in the lung at TLC or at RV? The answer lies in the properties of the lung parenchyma and in the interaction between the lungs and the chest wall. The lungs and chest wall always move together in healthy individuals. The lung contains elastic fibers that stretch when stress is applied, thereby resulting in an increase in lung volume, and that recoil passively when this stress is released, thereby resulting in a decrease in lung volume. The elastic recoil of the lung parenchyma is very high. In the absence of external forces (such as the force generated by the chest wall), the lung will become almost airless (10% of TLC). Similarly, chest wall volume can increase when the respiratory muscles are stretched and decrease when respiratory muscle length is shortened. In the absence of the lung parenchyma, the volume of the chest wall is approximately 60% of TLC.
|
| page 430 |  | | page 431 |
| Figure 21-1 The various lung volumes and capacities. ERV, expiratory reserve volume; FRC, functional residual capacity; FVC, forced vital capacity; IC, inspiratory capacity; IRV, inspiratory reserve volume; RV, residual volume; TLC, total lung capacity; VC, vital capacity; VT, tidal volume. |
| Lung volumes are determined by the balance between the lung's elastic properties and the properties of the muscles of the chest wall. The maximum volume of air contained within the lung and the chest wall (i.e., TLC) is controlled by the muscles of inspiration. With increasing lung volume, the chest wall muscles lengthen progressively. As these muscles lengthen, their ability to generate force decreases. TLC occurs when the inspiratory chest wall muscles
are unable to generate the additional force needed to further distend the lung and chest wall. Similarly, the minimal volume of air in the lung (i.e., RV) is controlled by the expiratory muscle force. Decreasing lung volume results in shortening of the expiratory muscles, which in turn results in a decrease in muscle force. The decrease in lung volume is also associated with an increase in the outward recoil pressure of the chest wall. RV occurs when expiratory muscle force is insufficient to further reduce chest wall volume.
|
| FRC, or the volume of the lung at the end of a normal exhalation, is determined by the balance between the elastic recoil pressure generated by the lung parenchyma to become smaller (inward recoil) and the pressure generated by the chest wall to become larger (outward recoil). When the chest wall muscles are weak, FRC decreases (lung elastic recoil > chest wall muscle force). In the presence of airway obstruction, FRC increases because of premature airway closure, which traps air in the lung.
|
| Measurement of Lung Volumes
|
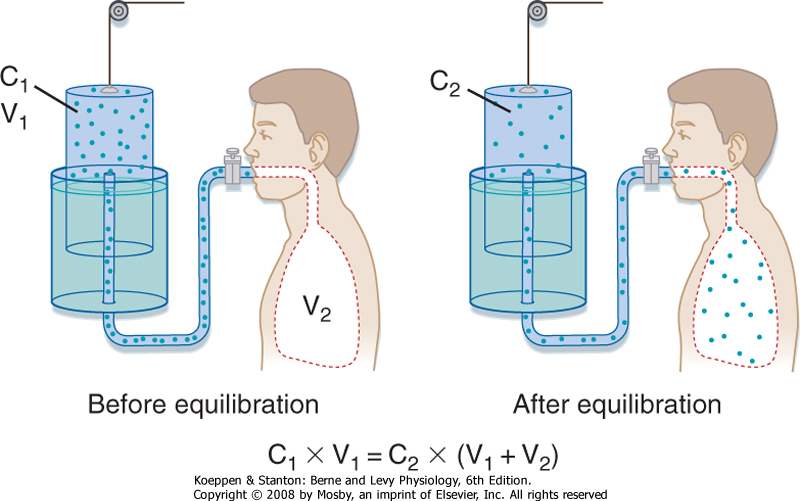
| RV and TLC can be measured in two ways: by helium dilution and by body plethysmography. Both are used clinically and provide valuable information about lung function and lung disease. The helium dilution technique is the older and simpler method, but it is often less accurate than body plethysmography, which requires sophisticated and expensive equipment.
|
| In normal individuals, the FRC measured by helium dilution and the FRC measured by plethysmography are the same. This is not true in individuals with lung disease. The FRC measured by helium dilution measures the volume of gas in the lung that communicates with the airways, whereas the FRC measured by plethysmography measures the total volume of gas in the lung at the end of a normal exhalation. If a significant amount of gas is trapped in the lung (because of premature airway closure), the FRC determined by plethysmography will be considerably greater than that measured by helium dilution.
|
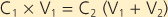
In the helium dilution technique, a known concentration of an inert gas (such as helium) is added to a box of known volume. The box is then connected to a volume that is unknown (the lung volume to be measured). After adequate time for distribution of the inert gas, the new concentration of the inert gas is measured. The change in concentration of the inert gas is then used to determine the new volume in which the inert gas has been distributed (Fig. 21-2). Specifically,
 |
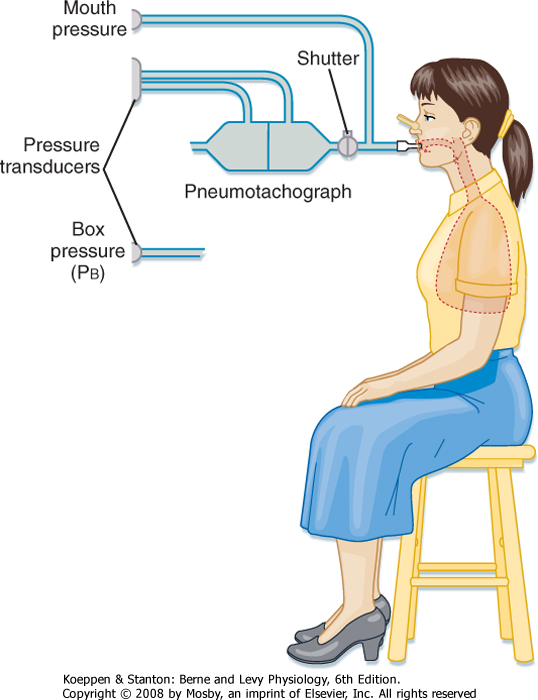
Measurement of lung volumes with a body plethysmograph (body box) uses Boyle's gas law, which states that pressure multiplied by volume is constant (at a constant temperature). The subject sits in an airtight box (Fig. 21-3) and breathes through a mouthpiece that is connected to a flow sensor (pneumotach). The subject then makes panting respiratory effort against a closed mouthpiece. During the expiratory phase of the maneuver, the gas in the lung becomes compressed, lung volume decreases, and the pressure inside the box falls because the gas volume in the box increases. By knowing the volume of the box and measuring the change in pressure of the box at the mouth, the change in volume of the lung can be calculated. Thus,
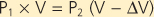
where P1 and P2 are mouth pressures and V is FRC. |
| page 431 | | | page 432 |
| Figure 21-2 Measurement of lung volume by helium dilution. |
| Figure 21-3 The body plethysmograph. |
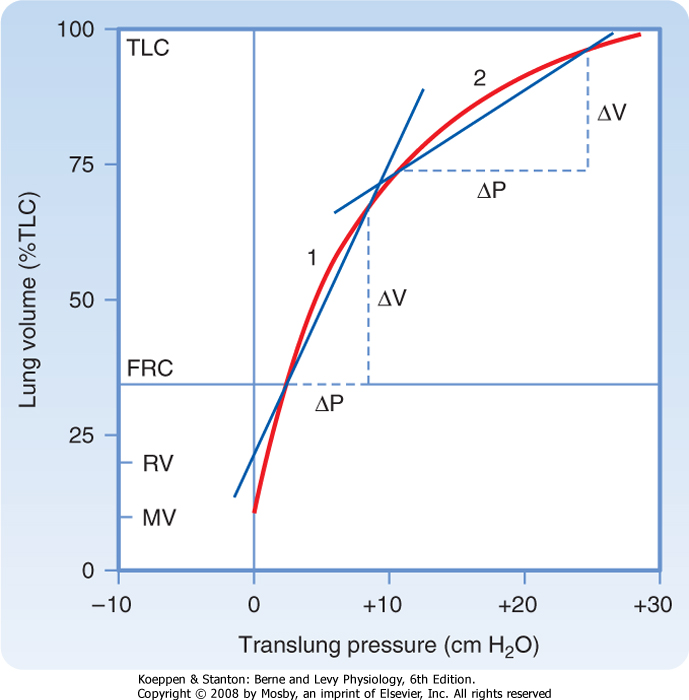
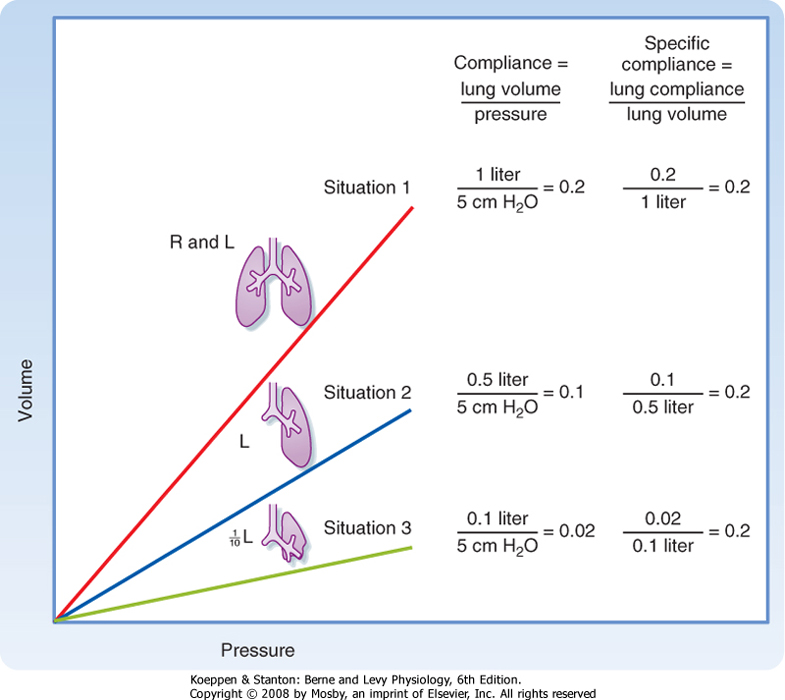
| Figure 21-4 Deflation pressure-volume (PV) curve. Because of hysteresis caused by surfactant, the deflation PV curve is used for measurements. Compliance at any point along this curve is the change in volume per change in pressure. From the curve it can be seen that lung compliance varies with lung volume. Compare the compliance at 1 versus 2. By convention, lung compliance is the change in pressure in going from FRC to FRC +1 L. |
Lung compliance (CL) is a measure of the elastic properties of the lung. It is a measure of how easily the lung is distended. Lung compliance is defined as the change in lung volume resulting from a 1-cm H2O change in the distending pressure of the lung. The units of
compliance are mL (or L)/cm H2O. High lung compliance refers to a lung that is readily distended. Low lung compliance, or a "stiff" lung, is a lung that is not easily distended. The compliance of the lung is thus
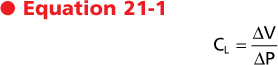
where ΔV is the change in volume and ΔP is the change in pressure. Graphically, lung compliance is the slope of the line between any two points on the deflation limb of the pressure-volume loop (Fig. 21-4). The compliance of a normal human lung is about 0.2 L/cm H2O, but it varies with lung volume. Note that the lung is
less distensible at high lung volumes. For this reason, compliance is corrected for the lung volume at which it is measured (specific compliance) (Fig. 21-5). Changes in lung compliance are associated with certain types of lung disease (e.g., restrictive lung diseases) and are of great clinical importance. Compliance measurements are not often performed for clinical purposes, however, because they require placement of an esophageal balloon. The esophageal balloon, which is connected to a pressure transducer, is an excellent surrogate marker for pleural pressure. The change in pleural pressure (Ppl) is measured as a function of the change in lung volume; that is, CL = ΔV/ΔPpl.
|
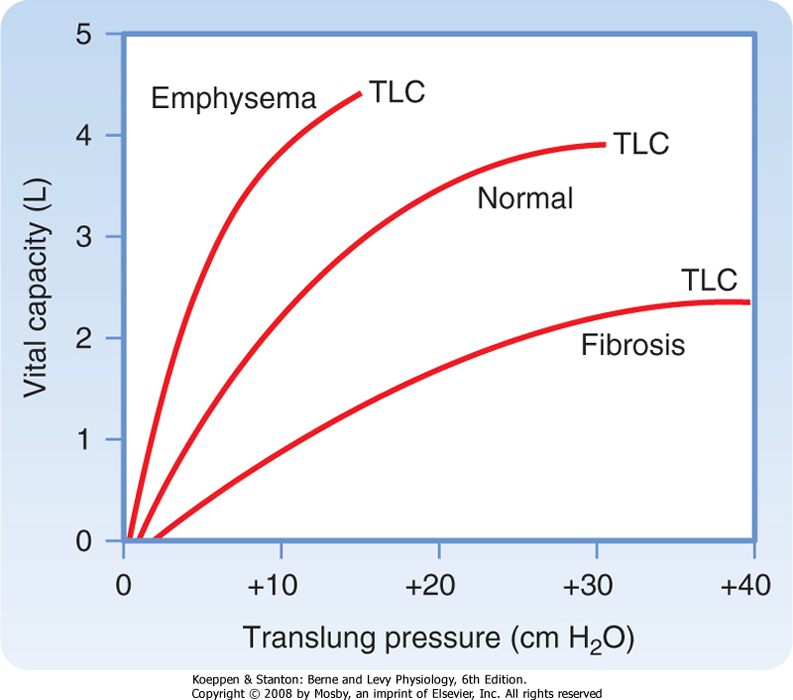
| The compliance of the lung is affected by several respiratory disorders. In emphysema, an obstructive lung disease usually of smokers associated with destruction of the alveolar septa and pulmonary capillary bed, the lung is more compliant; that is, for every 1-cm H2O increase in pressure, the increase in volume is greater than in a normal lung (Fig. 21-6). In contrast, in pulmonary fibrosis, a restrictive lung disease associated with increased collagen fiber deposition in the interstitial space, the lung is noncompliant; that is, for every 1-cm H2O change in pressure, the change in volume is less.
|
| Lung-Chest Wall Interactions
|
| page 432 | | | page 433 |
| Figure 21-5 Relationship between compliance and lung volume. Imagine a lung in which a 5-cm H2O change in pressure results in a 1-L change in volume. If half of the lung is removed, the compliance will decrease, but when corrected for volume of the lung, there is no change (specific compliance). Even when the lung is reduced by 90%, the specific compliance is unchanged. |
| Figure 21-6 Fibrosis/emphysema pressure-volume curve. |
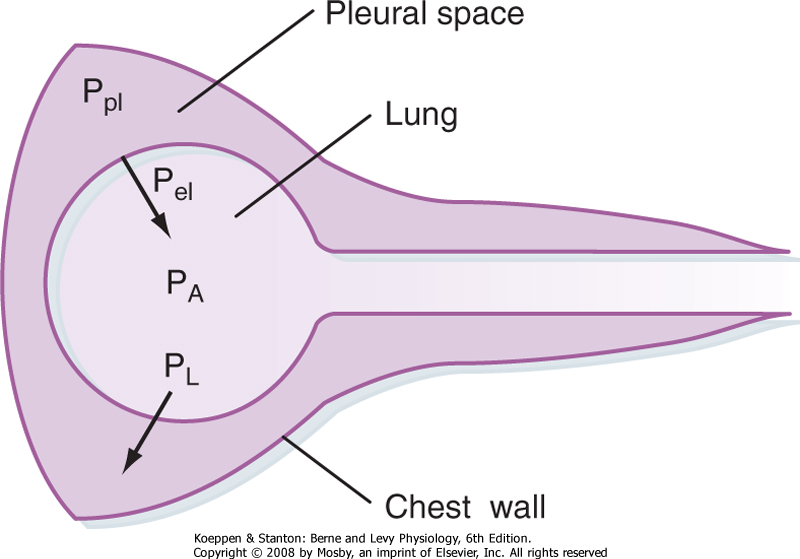
The lung and chest wall move together as a unit in healthy people. Separating these structures is the pleural space, which is best thought of as a potential
space. Because the lung and chest wall move together, changes in their respective volumes are equal. An understanding of the pressures that surround the lung and chest wall and result in changes in lung volume is essential to comprehend how the lungs work. The pressure changes across the lung and across the chest wall are defined as transmural pressure. For the lung, this transmural pressure is called the transpulmonary (or translung) pressure (PL), and it is defined as the pressure difference between the air spaces (alveolar pressure [PA]) and the pressure surrounding the lung (pleural pressure ]Ppl]). That is,

|
| The lung requires positive transpulmonary pressure to increase its volume, and lung volume increases with increasing transpulmonary pressure (Fig. 21-6). The lung assumes its smallest size when transpulmonary pressure is zero. The lung, however, is not totally devoid of air when transpulmonary pressure is zero because of the surface tension-lowering properties of surfactant (see Chapter 20).
|
The transmural pressure across the chest wall (Pw) is the difference between pleural pressure and the pressure surrounding the chest wall (Pb), which is the barometric pressure or body surface pressure. That is,

|
| During inspiration, the chest wall expands to a larger volume. Because pleural pressure is negative relative to atmospheric pressure during quiet breathing, the transmural pressure across the chest wall is negative.
|
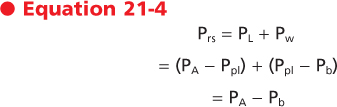
The pressure across the respiratory system (Prs) is the sum of the pressure across the lung and the pressure across the chest wall. That is,
|
| page 433 | | | page 434 |
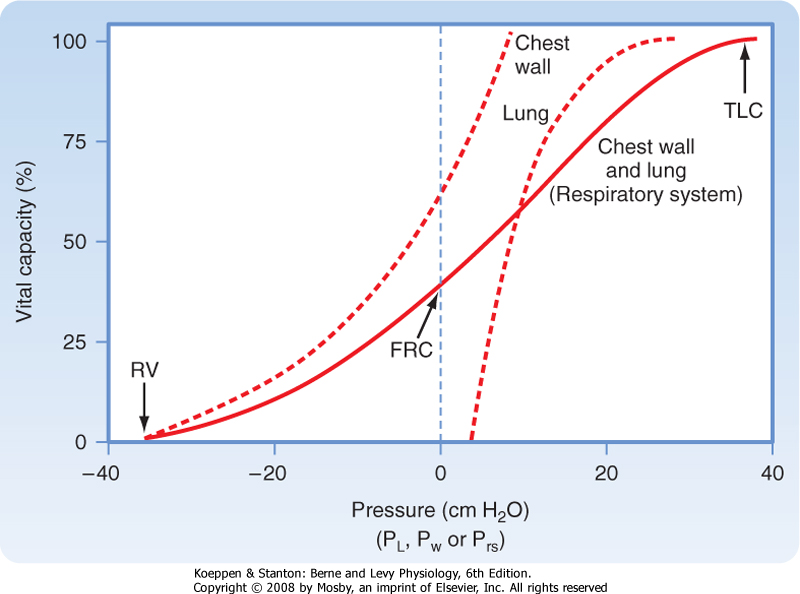
| Figure 21-7 Relaxation pressure-volume curve of the lung, chest wall, and respiratory system. The curve for the respiratory system is the sum of the individual curves. The curve for the lung is the same as in Figure 21-6. |
| The pressure-volume relationships for the lung alone, for the chest wall alone, and for the intact respiratory system are shown in Figure 21-7. A number of important observations can be made by examining the pressure-volume curves of the lung, chest wall, and respiratory system. Note that the transmural pressure across the respiratory system at FRC is zero. At TLC, both lung pressure and chest wall pressure are positive, and they both require positive transmural distending pressure. The resting volume of the chest wall is the volume at which the transmural pressure for the chest wall is zero, and it is approximately 60% of TLC. At volumes greater than 60% of TLC, the chest wall is recoiling inward and positive transmural pressure is needed, whereas at volumes below 60% of TLC, the chest wall tends to recoil outward.
|
| The transmural pressure for the lung alone flattens at pressures greater than 20 cm H2O because the elastic limits of the lung have been reached. Thus, further increases in transmural pressure produce no change in volume and compliance is low. Further distention is limited by the connective tissue (collagen, elastin) of the lung. If further pressure is applied, the alveoli near the lung surface can rupture and air can escape into the pleural space. This is called pneumothorax.
|
| Figure 21-8 Relationship between transpulmonary pressure (PL) and the pleural (Ppl), alveolar (PA), and elastic recoil (Pel) pressures of the lung. Alveolar pressure is the sum of pleural pressure and elastic recoil pressure. Transpulmonary pressure is the difference between pleural pressure and alveolar pressure. |
The relationship between pleural, alveolar, and elastic recoil pressure is shown in Figure 21-8. Alveolar pressure is the sum of the pleural pressure and elastic recoil pressure of the lung.

Because PL = PA - Ppl,

Thus,
 In general, PL is the pressure distending the lung, whereas Pel is the pressure tending to collapse the lung.
|
| Pressure-Volume Relationships
|
Air flows into and out of the airways from areas of higher pressure to areas of lower pressure. In the absence of a pressure gradient, there is no airflow. Minute ventilation is the volume of gas that is moved per unit of time. It is equal to the volume of gas moved with each breath times the number of breaths per minute:
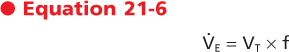
where VE is minute ventilation in mL or L/min, VT is tidal volume in mL or L, and f is the frequency or number of breaths per minute.
|
| page 434 | | | page 435 |
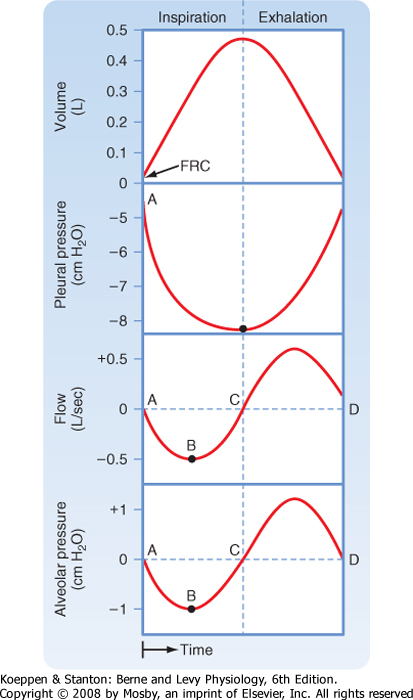
| To understand the relationship between changes in pressure and changes in volume, it is helpful to examine the pressure changes during inspiration and exhalation (Fig. 21-9). In normal individuals during tidal volume breathing, alveolar pressure decreases at the start of inspiration. This decrease in alveolar pressure is usually small (1 to 3 cm H2O). It is much larger in individuals with airway obstruction because of the larger pressure drop that occurs across obstructed airways. |
| Pressure within the pleural space (pleural pressure) also falls during inspiration. This decrease equals the lung elastic recoil, which increases as the lung inflates. Pressure drops along the airways as gas flows from atmospheric pressure (zero) to the pressure in the alveolus (negative relative to atmospheric pressure). Airflow stops when alveolar pressure and atmospheric pressure become equal. |
| On exhalation, the diaphragm moves higher into the chest, pleural pressure increases (i.e., becomes less negative), alveolar pressure becomes positive, the glottis opens, and gas again flows from a higher (alveolus) to a lower (atmospheric) pressure. In the alveolus, the driving force for exhalation is the sum of the elastic recoil of the lung and pleural pressure. |
|
| Before inspiration begins, the pleural pressure in normal individuals is approximately -5 cm H2O. Thus, the pressure in the pleural space is negative relative to atmospheric pressure (by convention, atmospheric pressure is considered to be 0). This negative pressure is created by the inward elastic recoil pressure of the lung, and it acts to pull the lung away from the chest wall. Just before inspiration begins, alveolar pressure is zero because with no gas flow, there is no pressure drop along the airways. With the onset of inspiration, the muscles of the diaphragm and chest wall shorten, which causes a downward movement of the diaphragm and outward and upward movement of the rib cage. Alveolar pressure falls below zero, and when the glottis opens, gas moves into the airways.
|
| Note that at the resting volume of the lung (FRC), the elastic recoil of the lung acts to decrease lung volume, but this inward recoil is offset by the outward recoil of the chest wall, which acts to increase lung volume. At FRC, these forces are equal and opposite, and the muscles are relaxed. When the chest is opened, as during thoracic surgery, the lung recoils until transpulmonary pressure is zero and the chest wall increases in size. The lungs do not, however, become airless but retain approximately 10% of their TLC.
|
| Figure 21-9 Changes in alveolar and pleural pressure during a tidal volume breath. Inspiration is to the left of the vertical dotted line and exhalation is to the right. Positive (relative to atmosphere) pressures are above the horizontal dotted line and negative pressures are below. See text for details. At points of no airflow, alveolar pressure is zero. |
| In this section we examine the principles that control air movement into and out of the lung. Dynamics is
that aspect of mechanics that studies physical systems in motion.
|
| Air flows through the airways when there is a pressure difference at the two ends of the airway. During inspiration, the diaphragm contracts, pleural pressure becomes more negative (relative to atmospheric pressure), and gas flows into the lung (from the higher to the lower pressure). Gas exchange to meet the changing metabolic needs of the body depends on the speed at which fresh gas is brought to the alveoli and the rapidity with which the metabolic products of respiration (i.e., CO2) are removed. Two major factors determine the speed at which gas flows into the airways for a given pressure change: the pattern of gas flow and the resistance to airflow by the airways. We examine each of these factors here.
|
| page 435 | | | page 436 |
| There are two major patterns of gas flow in the airways-laminar and turbulent flow. Laminar flow is parallel to the airway walls and is present at low flow
rates. As the flow rate increases and particularly as the airways divide, the flow stream becomes unsteady and small eddies occur. At higher flow rates, the flow stream is disorganized and turbulence occurs.
|
The pressure-flow characteristics of laminar flow were first described by the French physician Poiseuille and apply both to liquids and to air. In straight circular tubes, the flow rate (V), is defined by the following equation:
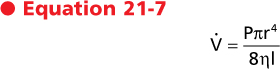
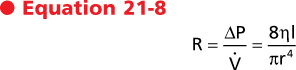
where P is the driving pressure, r is the radius of the tube, η is the viscosity of the fluid, and l is the length of the tube. It can be seen that driving pressure (P) is proportional to the flow rate (V); thus, the greater the pressure, the greater the flow. The flow resistance, R, across a set of tubes is defined as the change in driving pressure (ΔP) divided by the flow rate, or
|
| The units of resistance are cm H2O/L · sec. This equation for laminar flow demonstrates that the radius of the tube is the most important determinant of resistance. If the radius of the tube is reduced in half, the resistance will increase 16-fold. If, however, tube length is increased twofold, the resistance will increase only twofold. Thus, the radius of the tube is the principal determinant of resistance. Stated another way, resistance is inversely proportional to the fourth power of the radius, and it is directly proportional to the length of the tube and to the viscosity of the gas.
|
| In turbulent flow, gas movement occurs both parallel and perpendicular to the axis of the tube. Pressure is proportional to the flow rate squared. The viscosity of the gas increases with increasing gas density, and therefore the pressure drop increases for a given flow. Overall, gas velocity is blunted because energy is consumed in the process of generating eddies and chaotic movement. As a consequence, higher driving pressure is needed to support a given turbulent flow than to support a given laminar flow.
|
Whether flow through a tube is laminar or turbulent depends on the Reynolds number. The Reynolds number (Re) is a dimensionless value that expresses the ratio of two dimensionally equivalent terms (kinematic/viscosity).
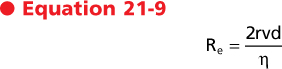
where d is the fluid density, v is the average velocity, r is the radius, and η is the viscosity. In straight tubes, turbulence occurs when the Reynolds number is greater than 2000. From this relationship it can be seen that turbulence is most likely to occur when the average velocity of the gas flow is high and the radius is large. In contrast, a low-density gas, such as helium, is less likely to cause turbulent flow.
|
| Although these relationships apply well to smooth cylindrical tubes, application of these principles to a complicated system of tubes, such as the conducting airways, is difficult. As a result, much of the flow in the airways demonstrates characteristics of both laminar and turbulent flow. During quiet breathing, gas flow at the mouth is approximately 1 L/sec. Gas velocities of 150 cm/sec will occur in an adult with a tracheal diameter of 3 cm. Because air has a density of 0.0012 g/mL and a viscosity of 1.83 × 10⁻⁴ g/cm/sec, the Reynolds number is greater than 2000. Hence, turbulent flow occurs in the trachea, even during quiet breathing.
|
| Turbulence is also promoted by the glottis and vocal cords, which produce some irregularity and obstruction in the airways. As gas flows distally, the total cross-sectional area increases dramatically, and gas velocities decrease significantly. As a result, gas flow becomes more laminar in the smaller airways, even during maximal ventilation. Overall, the gas flow in the larger airways (nose, mouth, glottis, and bronchi) is turbulent, whereas the gas flow in the smaller airways is laminar. Breath sounds heard with a stethoscope reflect turbulent airflow. Laminar flow is silent.
|
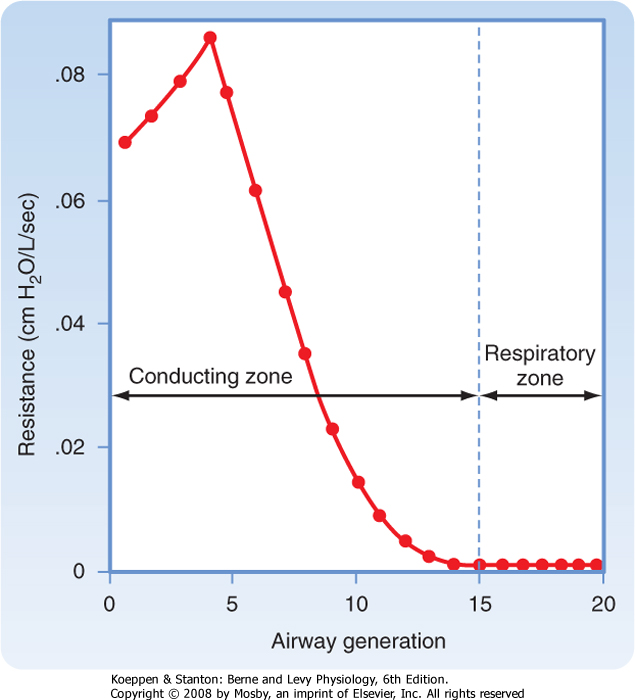
Airflow resistance is the second major factor that determines rates of airflow in the airways. Airflow resistance in the airways (Raw) differs in airways of different size. In moving from the trachea toward the alveolus, individual airways become smaller while the number of airway branches increases dramatically. Raw is equal to the sum of the resistance of each of these airways (i.e., Raw = Rlarge + Rmedium + Rsmall). From Poiseuille's equation, one might conclude that the major site of airway resistance is in the smallest airways. In fact, however, the major site of resistance along the bronchial tree is the large bronchi. The smallest airways contribute very little to the overall total resistance of the bronchial tree (Fig. 21-10). The reason for this is twofold. First, airflow velocity decreases substantially as the effective cross-sectional area increases (i.e., flow becomes laminar). Second and most important, the airway generations exist in parallel rather than in series. The resistance of airways in parallel is the inverse of the sum of the individual resistances; therefore, the overall resistance of the small airways is very small. As an example, assume that each of three tubes has a resistance of 3 cm H2O. If the tubes are in series, the total resistance (Rtot) is the sum of the individual resistances:

|
If the tubes are in parallel (as they are in small airways), the total resistance is the sum of the inverse of the individual resistances:

|
| page 436 | | | page 437 |
| Figure 21-10 Airway resistance as a function of the airway generation. In a normal lung, most of the resistance to airflow occurs in the first eight airway generations. |
| This relationship is in marked contrast to the pulmonary blood vessels, in which most of the resistance is located in the small vessels. Thus, as airway diameter decreases, the resistance offered by each individual airway increases, but the large increase in the number of parallel pathways reduces the resistance at each generation of branching. During normal breathing, approximately 80% of the resistance to airflow at FRC occurs in airways with diameters greater than 2 mm. Because the small airways contribute so little to total lung resistance, measurement of airway resistance is a poor test for detecting small-airway obstruction.
|
| Factors That Contribute to Airway Resistance
|
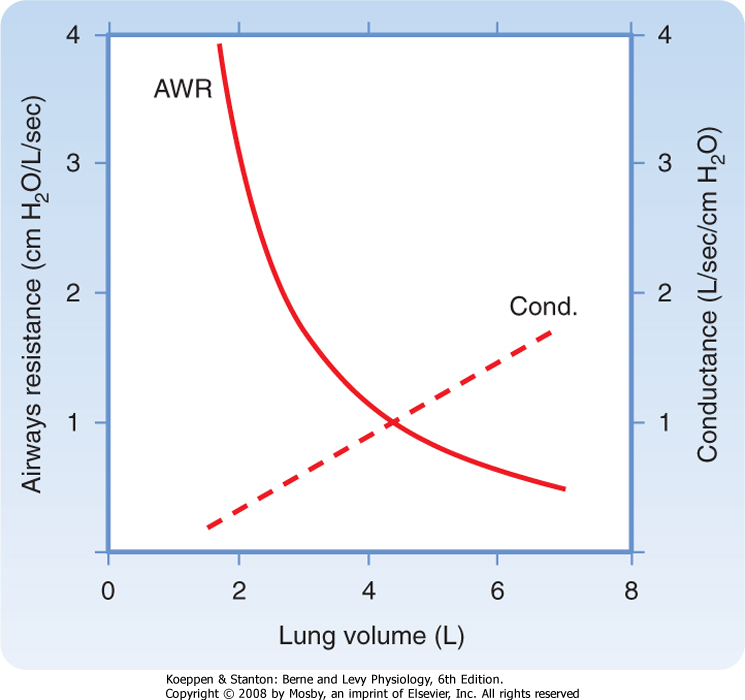
| In healthy individuals, airway resistance is approximately 1 cm H2O/L · sec. One of the most important factors affecting resistance is lung volume. Increasing lung volume increases the caliber of the airways. As a result, resistance to airflow decreases with increasing lung volume, and it increases with decreasing lung volume. If the reciprocal of resistance (i.e., conductance) is plotted against lung volume, the relationship between lung volume and conductance is linear (Fig. 21-11). Factors that increase airway resistance include airway mucus, edema, and contraction of bronchial smooth muscle, all of which decrease the caliber of the airways.
|
| Figure 21-11 Airway resistance (AWR) and conductance (Cond.) as a function of lung volume. |
| The density and viscosity of the inspired gas also affect airway resistance. When scuba diving, gas density rises and results in an increase in airway resistance; this increase can cause problems for individuals with asthma and obstructive pulmonary disease.
Breathing a low-density gas such as an oxygen-helium mixture results in a decrease in airway resistance and has been exploited in the treatment of status asthmaticus, a condition associated with increased airway resistance because of a combination of bronchospasm, airway inflammation, and mucus.
|
| Neurohumoral Regulation of Airway Resistance
|
| In addition to the effects of disease, airway resistance is regulated by various neural and humoral agents. Stimulation of efferent vagal fibers, either directly or reflexively, increases airway resistance and decreases anatomic dead space secondary to airway constriction (recall that the vagus nerve innervates airway smooth muscle). In contrast, stimulation of the sympathetic nerves and release of the postganglionic neurotransmitter norepinephrine inhibit airway constriction. Reflex stimulation of the vagus nerve by the inhalation of smoke, dust, cold air, or other irritants can also result in airway constriction and coughing. Agents such as histamine, acetylcholine, thromboxane A2, prostaglandin F2, and leukotrienes (LTB4, LTC4, and LTD4) are released by resident (e.g., mast cells and airway epithelial cells) and recruited (e.g., neutrophils and eosinophils) airway cells in response to various triggers, such as allergens and viral infections. These agents act directly on airway smooth muscle to cause constriction and an increase in airway resistance. Inhalation of methacholine, a derivative of acetylcholine, is used to diagnose airway hyperresponsiveness, which is one of the cardinal features of asthma. Although everyone is capable of responding to methacholine, airway obstruction develops in patients with asthma at much lower concentrations of inhaled methacholine.
|
| page 437 | | | page 438 |
| Measurement of Expiratory Flow
|
| Measurement of expiratory flow rates and expiratory volumes is an important clinical tool for evaluating and monitoring respiratory diseases. Commonly used clinical tests have the patient inhale maximally to TLC and then exhale as rapidly and completely as possible to RV. The test results are displayed either as a spirogram or as a flow-volume curve/loop. Results from individuals with suspected lung disease are compared with results predicted from normal healthy volunteers. Predicted or normal values vary with age, gender, ethnicity, height, and to a lesser extent, weight (Table 21-1). Abnormalities in values indicate abnormal pulmonary function and can be used to predict abnormalities in gas exchange. These values can detect the presence of abnormal lung function long before respiratory symptoms develop, and they can be used to determine disease severity and the response to therapy.
|
| In a methacholine challenge test, spirometry measurements are made after the patient inhales increasing concentrations of methacholine. The test is stopped when FEV1 falls by 20% or more or when a maximum concentration (25 mg/mL) of methacholine has been inhaled. The concentration of methacholine that produces a 20% decrease in FEV1 is called the PC (provocation concentration) 20. The lower the PC20, the more sensitive is an individual to methacholine. Most individuals with asthma have a PC20 less than 8 mg/mL of methacholine. |
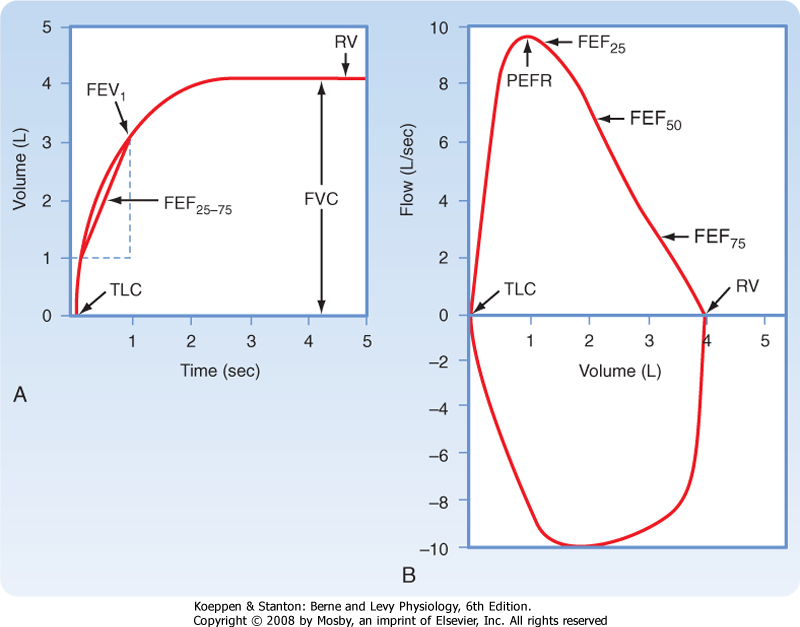
| A spirogram displays the volume of gas exhaled against time (Fig. 21-12, A) and provides four major test results: (1) forced vital capacity (FVC), (2) forced expiratory volume in 1 second (FEV1), (3) the ratio of FEV1 to FVC (FEV1/FVC), and (4) the average midmaximal expiratory flow (FEF25-75).
|
|
Table 21-1.
Normal Values (Average Adult White Man) |
| Lung Volumes |
| Functional residual capacity (FRC) | 2.4 L |
| Total lung capacity (TLC) | 6 L |
| Tidal volume (VT) | 0.5 L |
| Breathing frequency (f) | 12/min |
| Mechanics |
| Pleural pressure (Ppl), mean | -5 cm H2O |
| Chest wall compliance (Cw) at FRC | 0.2 L/cm H2O |
| Lung compliance (CL) at FRC | 0.2 L/cm H2O |
| Airway resistance (Raw) | 2.0 cm H2O/L/sec |
| Figure 21-12 The clinical spirogram (A) and flow-volume loop (B). The subject takes a maximal inspiration and then exhales as rapidly, as forcibly, and as maximally as possible. The volume exhaled is plotted as a function of time. In the spirogram that is reported in clinical settings, exhaled volume increases from the bottom of the trace to the top (A). This is in contrast to the physiologist's view of the same maneuver (see Fig. 21-1), in which the exhaled volume increases from the top to the bottom of the trace. Note the locations of TLC and RV on both tracings. |
| page 438 | | | page 439 |
| The total volume of air that is exhaled during a maximal forced exhalation from TLC to RV is called the FVC. The volume of air that is exhaled in the first second during the maneuver is called the FEV1. In normal individuals, at least 72% of the FVC can be exhaled in the first second. Thus, the FEV1/FVC ratio is greater than 72% in normal individuals. A ratio less than 72% suggests difficulty exhaling because of obstruction and is a hallmark of obstructive pulmonary disease. One expiratory flow rate-the average flow rate over the middle section of VC-can be calculated from the spirogram. This expiratory flow rate has
several names, including MMEF (midmaximal expiratory flow) and FEF25-75 (forced expiratory flow from 25% to 75% of VC). Although it can be calculated from the spirogram, today's spirometers automatically calculate FEF25-75.
|
| A newer way of measuring lung function clinically is the flow-volume curve or loop. A flow-volume curve or loop is created by displaying the instantaneous flow rate during a forced maneuver as a function of the volume of gas. This instantaneous flow rate can be displayed both during exhalation (expiratory flow-volume curve) and during inspiration (inspiratory flow-volume curve) (Fig. 21-12, B). Expiratory flow rates are displayed above the horizontal line and inspiratory flow rates below the horizontal line. The flow-volume loop yields data for three main pulmonary function tests: (1) the FVC; (2) the greatest flow rate achieved during the expiratory maneuver, called the peak expiratory flow rate (PEFR), and (3) expiratory flow rates. When the expiratory flow-volume curve is divided into quarters, the instantaneous flow rate at which 50% of the VC remains to be exhaled is called the FEF50 (also known as the Vmax50), the instantaneous flow rate at which 75% of the VC has been exhaled is called the FEF75 (Vmax75), and the instantaneous flow rate at which 25% of the VC has been exhaled is called the FEF25 (Vmax25).
|
| Determinants of Maximal Flow
|
| The shape of the flow-volume loop reveals important information about normal lung physiology that can be altered by disease. Inspection of the flow-volume loop reveals that the maximum inspiratory flow is the same or slightly greater than the maximum expiratory flow. Three factors are responsible for the maximum inspiratory flow. First, the force that is generated by the inspiratory muscles decreases as lung volume increases above RV. Second, the recoil pressure of the lung increases as the lung volume increases above RV. This opposes the force generated by the inspiratory muscles and reduces maximum inspiratory flow. However, airway resistance decreases with increasing lung volume as the airway caliber increases. The combination of inspiratory muscle force, recoil of the lung, and changes in airway resistance causes maximal inspiratory flow to occur about halfway between TLC and RV.
|
|
| Figure 21-13 Isovolume curves. Three superimposed expiratory flow maneuvers are made with increasing effort. Note that peak inspiratory and expiratory flow rates are dependent on effort, whereas expiratory flow rates later in expiration are independent of effort. |
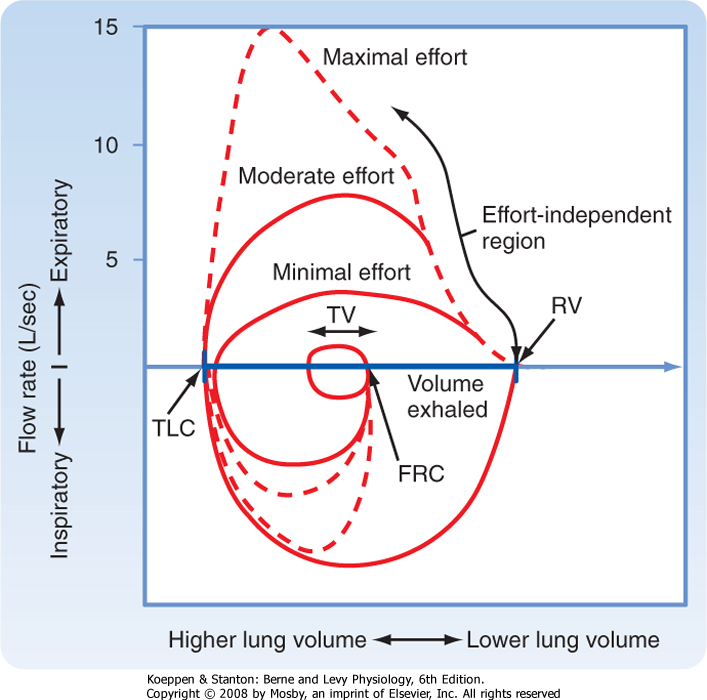
| During exhalation, maximal flow occurs early (in the first 20%) in the maneuver, and flow rates decrease progressively toward RV. Even with increasing effort, maximal flow decreases as RV is approached. This is known as "expiratory flow limitation" and can be demonstrated by asking an individual to perform three forced expiratory maneuvers with increasing effort. Figure 21-13 shows the results of these three maneuvers. As effort increases, peak expiratory flow increases. However, the flow rates at lower lung volumes converge; this indicates that with modest effort, maximal expiratory flow is achieved. No amount of effort will increase the flow rates as lung volume
decreases. For this reason, expiratory flow rates at lower lung volumes are said to be "effort independent" and "flow limited" because maximal flow is achieved with modest effort and no amount of additional effort can increase the flow rate beyond this limit. In contrast, events early in the expiratory maneuver are said to be "effort dependent"; that is, increasing effort generates increasing flow rates. In general, the first 20% of the flow in the expiratory flow-volume loop is effort dependent.
|
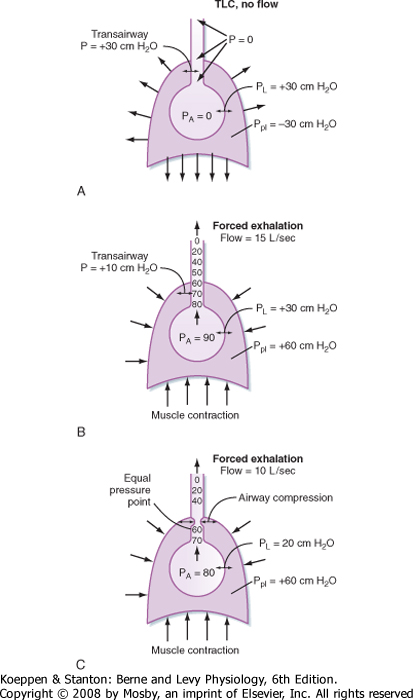
| Flow Limitation and the Equal Pressure Point
|
| page 439 | | | page 440 |
| Figure 21-14 Flow limitation. A, End inspiration, before the start of exhalation. B, At the start of a forced exhalation. C, Expiratory flow limitation later in a forced exhalation. Expiratory flow limitation occurs at locations where airway diameter is narrowed as a result of negative transmural pressure. See text for further explanation. |
| Why is expiratory flow limited? Factors that limit expiratory flow are important because many lung diseases affect these factors and thus affect the volume and speed with which air is moved into and out of the lung. Flow limitation occurs when the airways, which are intrinsically floppy distensible tubes, become compressed. The airways become compressed when the pressure outside the airway exceeds the pressure inside the airway. How and when this occurs is important to understand lung disease. Figure 21-14 shows the events that occur during expiratory flow limitation at two different lung volumes. The collective airways and alveoli are surrounded by the pleural space and the chest wall. The airways are shown as tapered tubes because the total or collective airway cross-sectional area decreases from the alveoli to the trachea. At the start of exhalation, but before any gas flow occurs, the pressure inside the alveolus (PA) is
zero (no airflow), and pleural pressure (in this example) is -30 cm H2O. Transpulmonary pressure is thus +30 cm H2O (PL = PA - Ppl). Because there is no flow, the pressure inside the airways is zero and the pressure across the airways (Pta, transairway pressure) is +30 cm H2O [Pta = Pairway - Ppl = 0 - (-30 cm H2O)]. This positive transpulmonary and transairway pressure holds the alveoli and airways open.
|
| When exhalation begins and the expiratory muscles contract, pleural pressure rises to +60 cm H2O (in this example). Alveolar pressure also rises, in part because of the increase in pleural pressure (+60 cm H2O) and in part because of the elastic recoil pressure of the lung at that lung volume (which in this case is 30 cm H2O). Alveolar pressure is the sum of pleural pressure and elastic recoil pressure (i.e., PA = Pel + Ppl = 30 cm H2O + 60 cm H2O = 90 cm H2O in this example). This is the driving pressure for expiratory gas flow. Because alveolar pressure exceeds atmospheric pressure, gas begins to flow from the alveolus to the mouth when the glottis opens. As gas flows out of the alveoli, the transmural pressure across the airways decreases (i.e., the pressure head for expiratory gas flow dissipates). This occurs for two reasons: first, there is a resistive pressure drop caused by the frictional pressure loss associated with flow (expiratory airflow resistance), and second, as the cross-sectional area of the airways decreases toward the trachea, gas velocity increases. This acceleration of gas flow further decreases the pressure.
|
| Thus, as air moves out of the lung, the driving pressure for expiratory gas flow decreases. In addition, the mechanical tethering that holds the airways open at high lung volumes diminishes as lung volume decreases. There is a point between the alveoli and the mouth at which the pressure inside the airways equals the pressure that surrounds the airways. This point is called the equal pressure point. Airways toward the mouth become compressed because the pressure outside is greater than the pressure inside (dynamic airway compression). As a consequence, the transairway pressure now becomes negative [Pta = Paw - Ppl = 58 - (+60) = -2 cm H2O just beyond the equal pressure point]. No amount of effort will increase the flow further because the higher pleural pressure tends to collapse the airway at the equal pressure point, just as it also tends to increase the gradient for expiratory gas flow. Under these conditions, airflow is independent of the total driving pressure. Hence, the expiratory flow is effort independent and flow limited. It is also why airway resistance is greater during exhalation than during inspiration. In the absence of lung disease, the equal pressure point occurs in airways that contain cartilage, and thus they resist collapse. The equal pressure point, however, is not static. As lung volume decreases and as elastic recoil pressure decreases, the equal pressure point moves closer to the alveoli.
|
| page 440 | | | page 441 |
| What happens in individuals with lung disease? Imagine an individual with airway obstruction secondary to a combination of mucus accumulation and airway inflammation. At the start of exhalation, the driving pressure for expiratory gas flow is the same as in a normal individual; that is, the driving pressure is the sum of the elastic recoil pressure and pleural pressure. As exhalation proceeds, however, the resistive drop in pressure is greater than in the normal individual because of the greater decrease in airway radius secondary to the accumulation of mucus and the inflammation. As a result, the equal pressure point
now occurs in small airways that are devoid of cartilage. These airways collapse. This collapse is known as premature airway closure. Premature airway closure results in a less than maximal exhalation that is known as air trapping and produces an increase in lung volume. The increase in lung volume initially helps offset the increase in airway resistance caused by the accumulation of mucus and inflammation because it results in an increase in airway caliber and elastic recoil. As the disease progresses, however, inflammation and accumulation of mucus increase further, there is a greater increase in expiratory resistance, and maximal expiratory flow rates decrease.
|
| Individuals with premature airway closure frequently have crackles, also sometimes called rales, a popping sound usually heard during inspiration on auscultation. These crackles are due to the opening of airways during inspiration that closed (i.e., were compressed) during the previous exhalation. Crackles can be due to mucus accumulation, airway inflammation, fluid in the airways, or any mechanism responsible for airway narrowing or compression. They are also heard in individuals with emphysema, in which there is a decrease in lung elastic recoil. In fact, acute and chronic lung diseases can change the expiratory flow-volume relationship by changes in (1) static lung recoil pressure, (2) airway resistance and the distribution of resistance along the airways, (3) loss of mechanical tethering of intraparenchymal airways, (4) changes in the stiffness or mechanical properties of the airways, and (5) differences in the severity of the aforementioned changes in various lung regions.
|
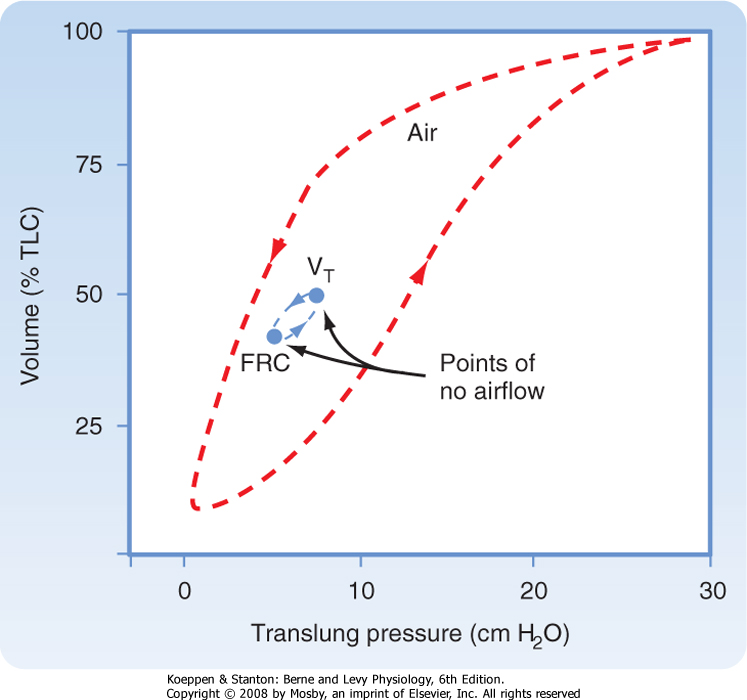
| One additional measurement of dynamic lung mechanics should be mentioned before leaving this subject, and this is the measurement of dynamic compliance. A dynamic pressure-volume curve can be created by having an individual breathe over a normal lung volume range (usually from FRC to FRC +1 L). The mean dynamic compliance of the lung (dyn CL) is calculated as the slope of the line that joins the end-inspiratory and end-expiratory points of no flow (Fig. 21-15).
|
| Dynamic compliance is always less than static compliance, and it increases during exercise. This is because during tidal volume breathing, a small change in alveolar surface area is insufficient to bring additional surfactant molecules to the surface and thus the lung is less compliant. During exercise, the opposite occurs; there are large changes in tidal volume and more surfactant material is incorporated into the air-liquid interface. Therefore, the lung is more compliant.
|
| Sighing and yawning increase dynamic compliance by increasing tidal volume and restoring the normal surfactant layer. Both these respiratory activities are important for maintaining normal lung compliance. In contrast to the lung, the dynamic compliance of the chest wall is not significantly different from its static compliance.
|
| Figure 21-15 Inflation-deflation pressure-volume curve. The direction of inspiration and exhalation is shown by the arrows. The difference between the inflation and deflation pressure-volume curves is due to the variation in surface tension with changes in lung volume. Note the slope of the line joining points of no airflow. This slope is less steep than the slope from the deflation pressure-volume curve at the same lung volume. |
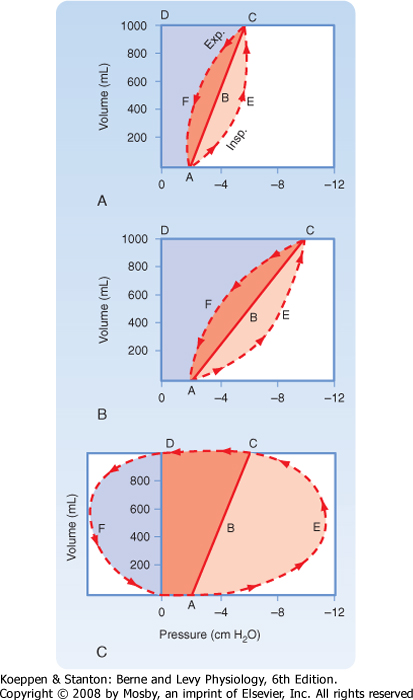
Breathing requires the use of respiratory muscles (diaphragm, intercostals, etc.), which expends energy. Work is required to overcome the inherent mechanical properties of the lung (i.e., elastic and flow-resistive forces) and to move both the lungs and the chest wall. This work is known as the work of breathing. Changes in the mechanical properties of the lung or chest wall (or both) in the presence of disease result in an increase in the work of breathing. Respiratory muscles can perform increased work over long periods. However, like other skeletal muscles, they can fatigue and respiratory failure may ensue. Respiratory muscle fatigue is the most common cause of respiratory failure, a process in which gas exchange is inadequate to meet the metabolic needs of the body. In the respiratory system, the work of breathing is calculated by multiplying the change in volume by the pressure exerted across the respiratory system. That is,

|
| page 441 | | | page 442 |
| Figure 21-16 Mechanical work done during a respiratory cycle in a normal lung (A), a lung with reduced compliance (B), and a lung with increased airway resistance (C). |
Although methods are not available to measure the total amount of work involved in breathing, one can estimate the mechanical work by measuring the volume and pressure changes during a respiratory cycle. Analysis of pressure-volume curves can be used to illustrate these points (Fig. 21-16). In Figure 21-16, A represents a respiratory cycle of a normal lung. The static inflation-deflation curve is represented by line ABC. The total mechanical workload is represented by the trapezoidal area OAECD. Breakdown of the
trapezoidal areas of Figure 21-16, A, enables one to appreciate the individual aspects of the mechanical workload, which include the following:
- OABCD:
- work necessary to overcome elastic resistance
- AECF:
- work necessary to overcome nonelastic resistance
- AECB:
- work necessary to overcome nonelastic resistance during inspiration
- ABCF:
- work necessary to overcome nonelastic resistance during exhalation (represents stored elastic energy from inspiration)
|
|
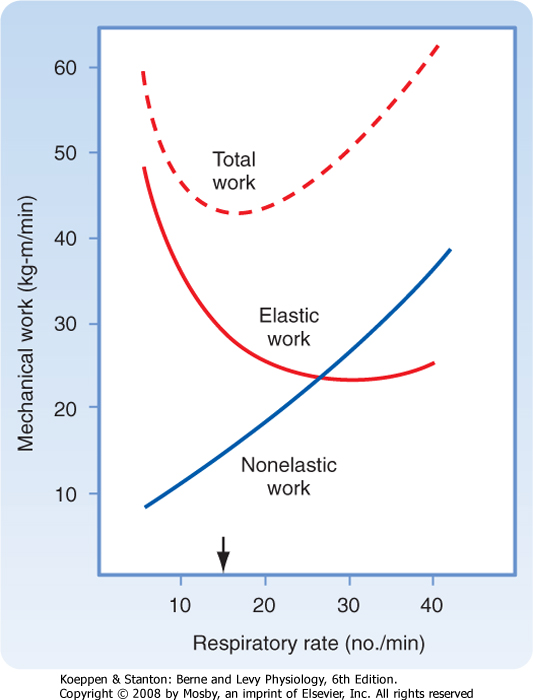
| Figure 21-17 Effect of the respiratory rate on the elastic, nonelastic, and total mechanical work of breathing at a given level of alveolar ventilation. Subjects tend to adopt the respiratory rate at which the total work of breathing is minimal (arrow). |
| In restrictive lung diseases, such as pulmonary fibrosis, lung compliance is decreased and the pressure-volume
curve is shifted to the right. This results in a significant increase in the work of breathing (Fig. 21-16, B), as indicated by the increase in the trapezoidal area of OAECD. In obstructive lung diseases, such as asthma or chronic bronchitis, airway resistance is elevated (Fig. 21-16, C), and greater negative pleural pressure is needed to maintain normal inspiratory flow rates. In addition to the increase in total inspiratory work (OAECD), individuals with obstructive lung disease have an increase in positive pleural pressure during exhalation because of the increase in resistance and the increased expiratory workload, which is visualized as area DFO. The stored elastic energy, represented by area ABCF of Figure 21-16, A, is not sufficient, and additional energy is needed for exhalation. With time or disease progression, these respiratory muscles can fatigue and result in respiratory failure. The work of breathing is also increased when deeper breaths are taken (an increase in tidal volume requires more elastic work to overcome) and when the respiratory rate increases (an increase in minute ventilation requires more flow resistance force to overcome) (Fig. 21-17). Normal individuals and individuals with lung disease adopt respiratory patterns that minimize the work of breathing. For this reason, individuals with pulmonary fibrosis (increased elastic work) breathe more shallowly and rapidly, and those with obstructive lung disease (normal elastic work) breathe more slowly and deeply.
|
| page 442 | | | page 443 |
| Chronic obstructive pulmonary disease (COPD) is a general term that includes diseases such as emphysema and chronic bronchitis. COPD most commonly occurs in individuals who smoke, in whom pathologic changes in the lung consistent with both emphysema and chronic bronchitis can coexist. For individuals with COPD in whom emphysema is a major component, the elastic tissue in the alveolar and capillary walls is progressively destroyed, which results in increased lung compliance and decreased elastic recoil. The decrease in elastic recoil results in movement of the equal pressure point toward the alveolus and premature airway closure. This produces air trapping and increases in RV, FRC, and TLC. Airway resistance is also increased. These increases in lung volumes increase the work of breathing by stretching the respiratory muscles and decreasing their efficiency. |
| In chronic bronchitis, accumulation of mucus and airway inflammation cause the equal pressure point to move toward the alveolus, which leads to premature airway closure and increases in RV, FRC, and TLC. Airway resistance and the work of breathing are increased, but lung compliance is normal. |
| In restrictive lung diseases such as pulmonary fibrosis, lung compliance is decreased. Lung volumes are decreased but flow rates are reasonably normal. The changes in pulmonary function values in obstructive and restrictive pulmonary diseases are shown in Table 21-2. |
| In the third trimester of pregnancy, the enlarged uterus increases intraabdominal pressure and restricts movement of the diaphragm. The FRC, as a result, decreases. This change in lung volume results in decreased lung compliance and increased airway resistance in otherwise healthy women. |
|
Table 21-2.
Patterns of Abnormalities in Pulmonary Function Test Results |
| Pulmonary Function Measurement | Obstructive Pulmonary Disease | Restrictive Pulmonary Disease |
| FVC (L) | Decrease | Decrease |
| FEV1 (L) | Decrease | Decrease |
| FEV1/FVC | Decrease | Normal |
| FEF25-75 (L/sec) | Decrease | Normal to increased |
| PEFR (L/sec) | Decrease | Normal |
| FEF50 (L/sec) | Decrease | Normal |
| FEF75 (L/sec) | Decrease | Normal |
| Slope of FV curve | Decrease | Normal to increased |
- Lung volumes are determined by the balance between the lung's elastic recoil properties and the properties of the muscles of the chest wall. Positive transpulmonary pressure is needed to increase lung volume. The pressure across the respiratory system is zero at points of no airflow (end inspiration and end exhalation). At FRC, the pressure difference across the respiratory system is zero, and lung elastic recoil pressure, which operates to decrease lung volume, and the pressure generated by the chest wall to become larger are equal and opposite.
- Lung compliance is a measure of the elastic properties of the lung. Loss of elastic recoil is seen in patients with emphysema and is associated with an increase in lung compliance, whereas in diseases associated with pulmonary fibrosis, lung compliance is decreased.
- Resistance to airflow is the change in pressure per unit of flow. Airway resistance varies with the inverse of the fourth power of the radius and is higher in turbulent than in laminar flow. The major site of airway resistance is the first eight airway generations. Airway resistance decreases with increases in lung volume and with decreases in gas density.
- The equal pressure point is the point at which the pressure inside and surrounding the airway is the same. The location of the equal pressure point is dynamic. Specifically, as lung volume and elastic recoil decrease, the equal pressure point moves toward the alveolus in normal individuals. In individuals with chronic obstructive pulmonary disease (COPD), the equal pressure point at any lung volume is closer to the alveolus.
- Pulmonary function tests (spirometry, flow-volume loop, body plethysmography) can detect abnormalities in lung function before individuals become symptomatic. Test results are compared with results obtained in normal individuals and vary with gender, ethnicity, age, and height. COPD is characterized by increases in lung volumes and airway resistance and by decreases in expiratory flow rates. Emphysema, a specific type of COPD, is further characterized by increased lung compliance. Restrictive lung diseases are characterized by decreases in lung volume, normal expiratory flow rates and resistance, and a marked decrease in lung compliance.
|
|
|